Projects
Internet of things Dashboard
An admin dashboard developed for NanoPowers IOT devices
During university me and a team of students collaborated with a local business, NanoPower, to develop a web based admin dashboard to display information from their line of IOT devices. NanoPower was working on implementing an iPhone and Android app, and a REST based API to be used with it. We were tasked with creating a website that used the same REST API to provide better visualisations, analysis and reporting than what the mobile app could do.
The dashboard was fully customisable by the user. It's main components are:
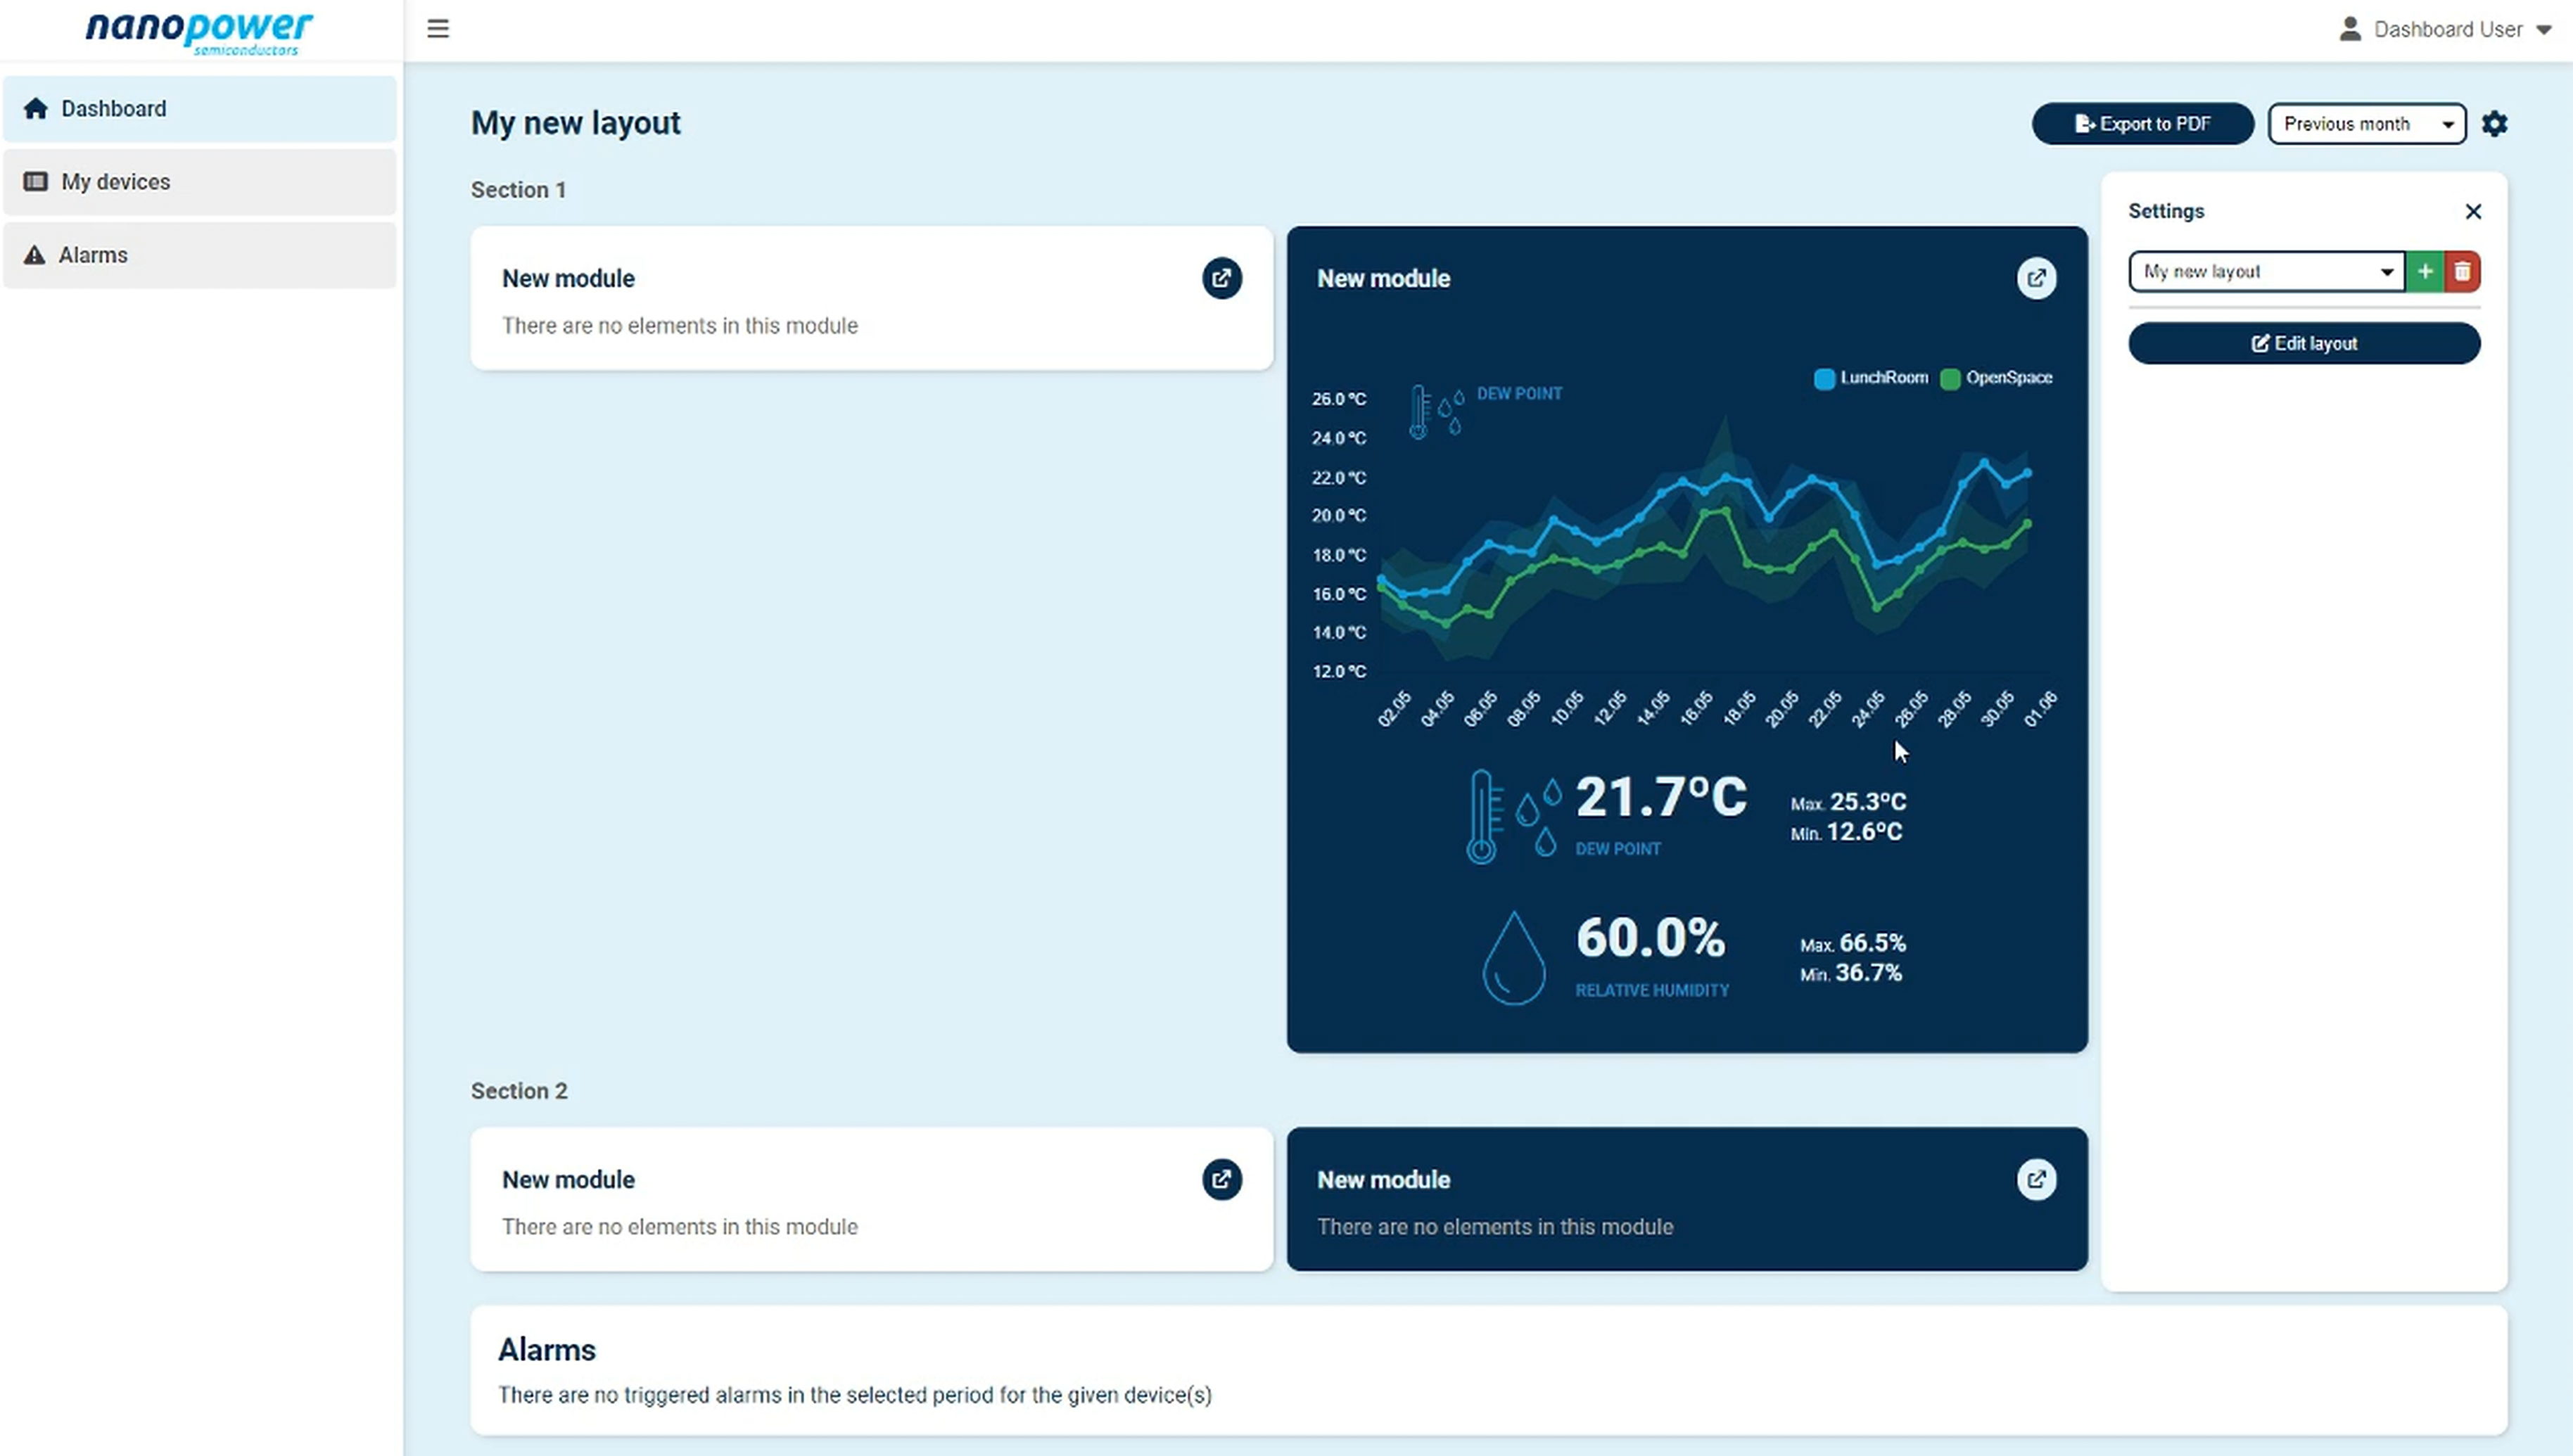
Layouts: a collection of modules
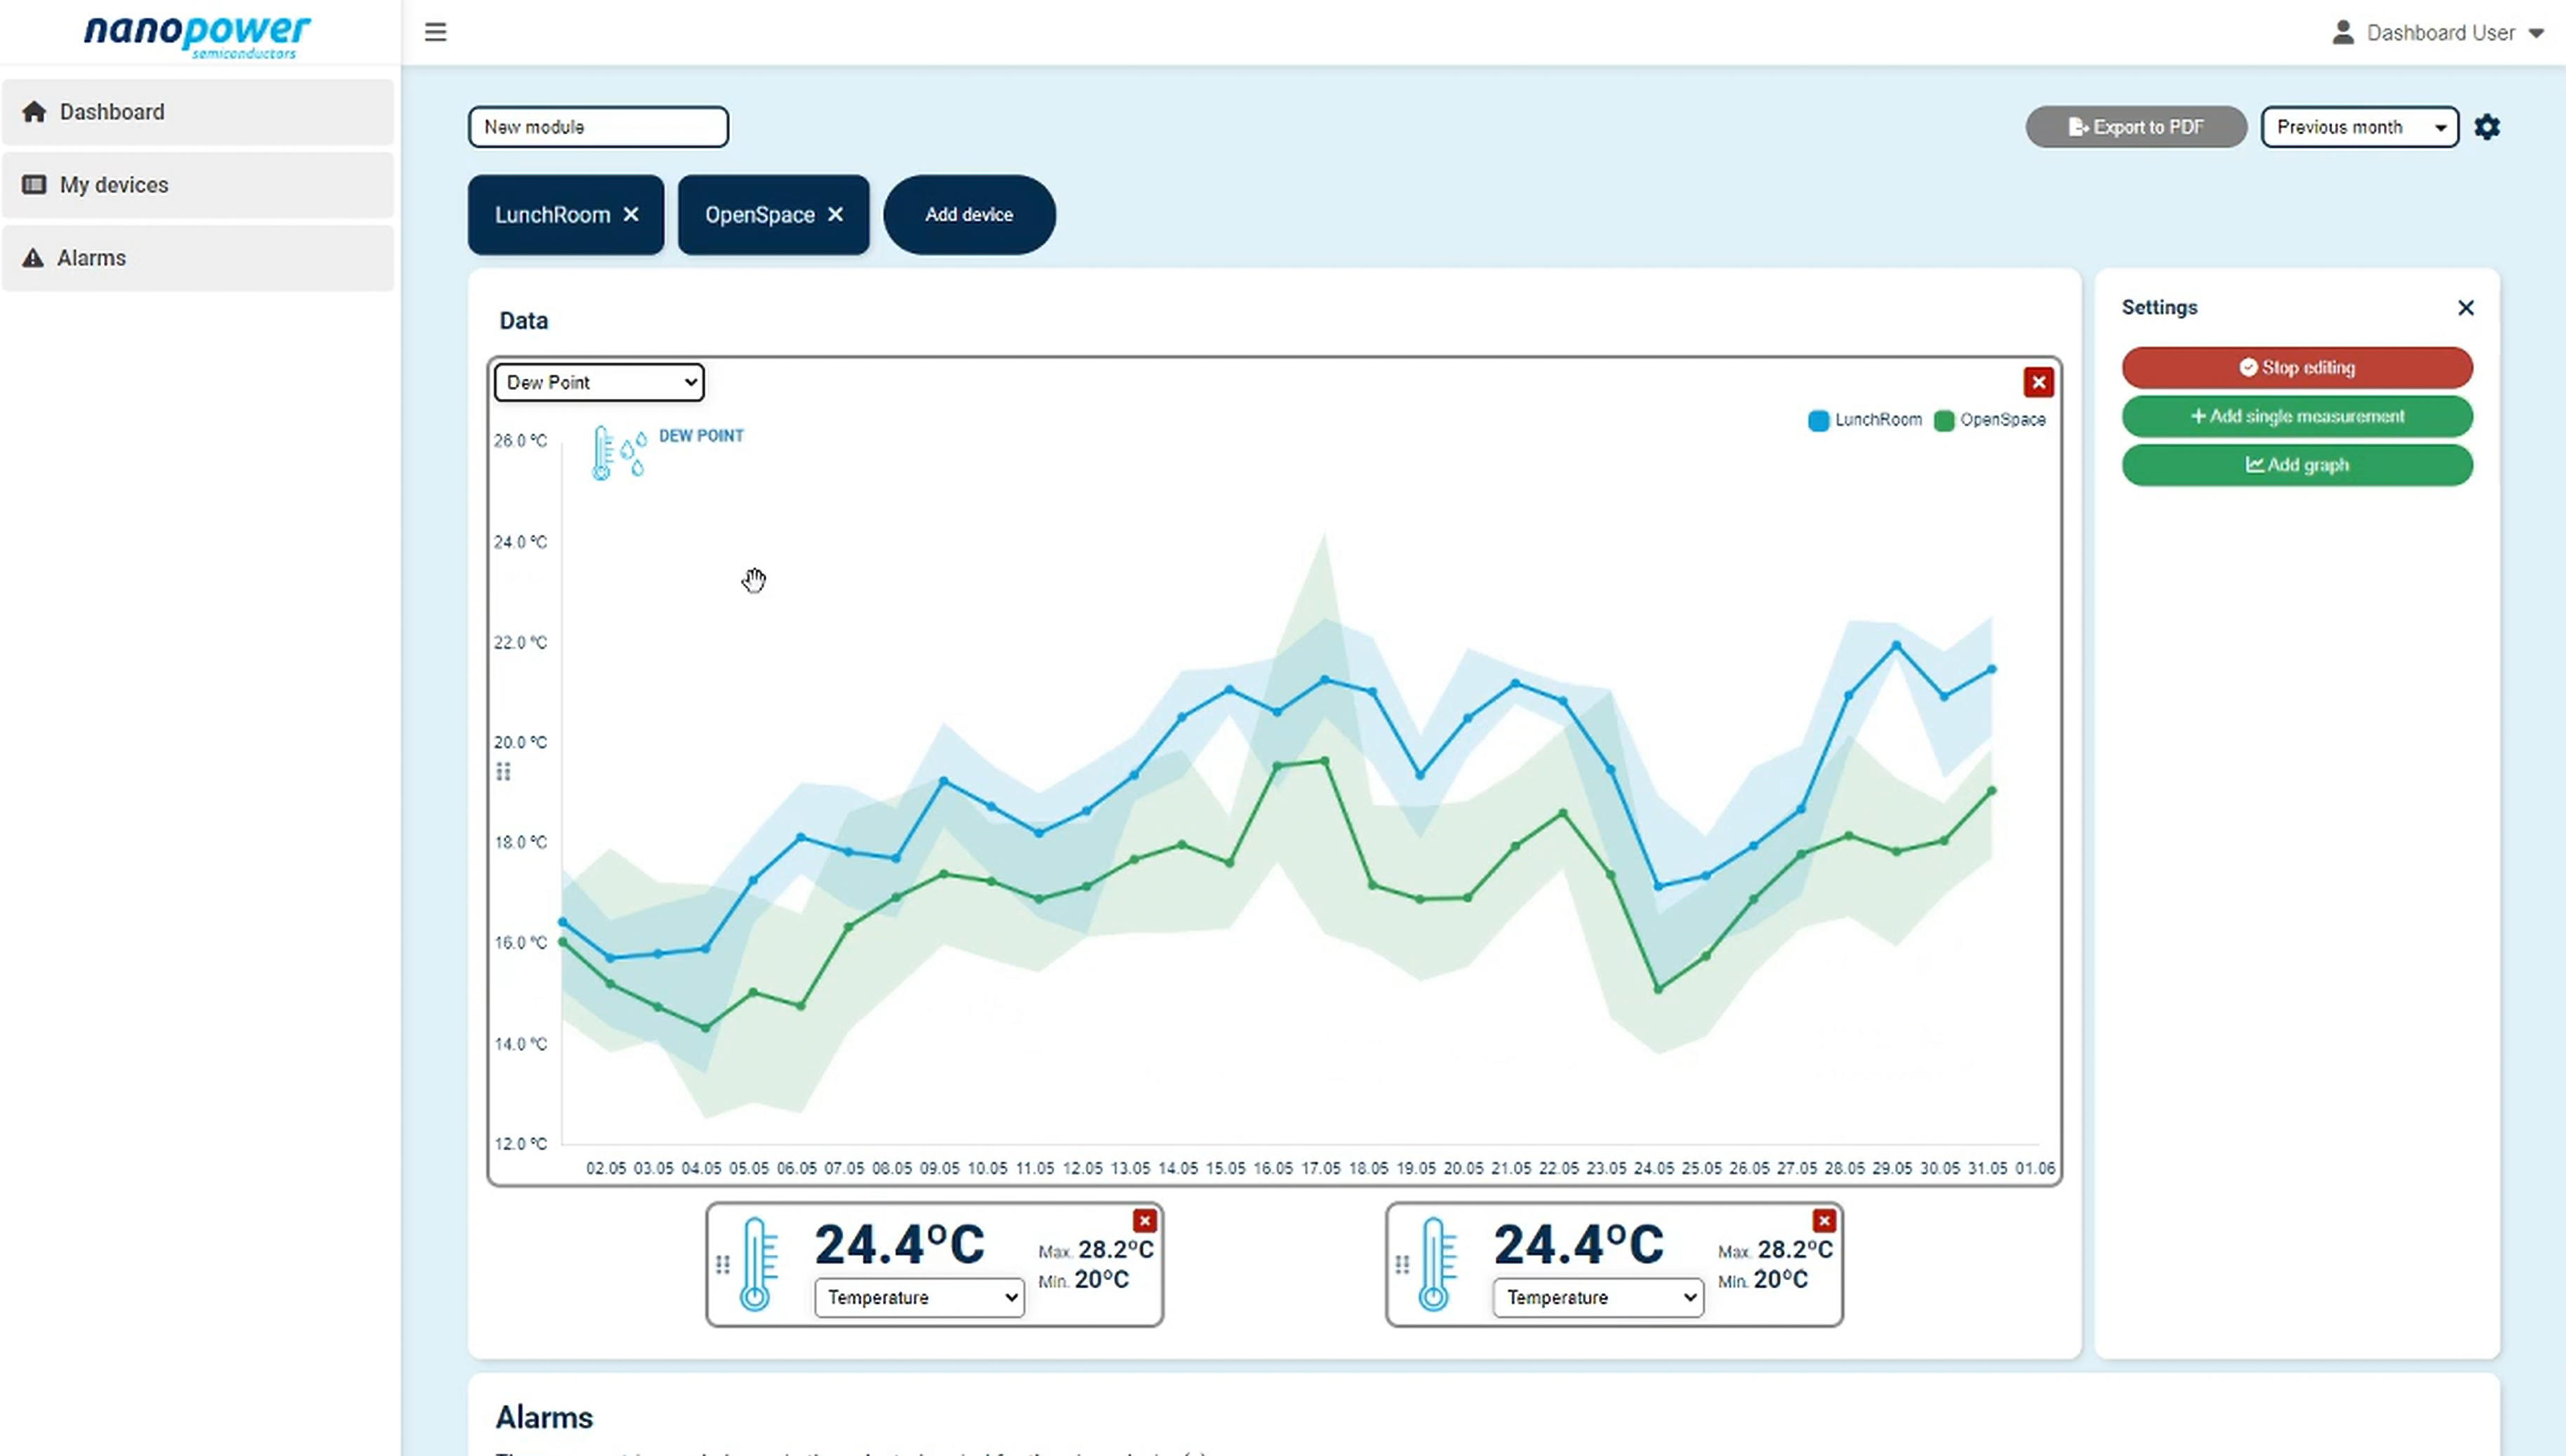
Modules: a collection of visualisations for one or more devices
Visualisations: a visualisation can be either a live measurement or a chart
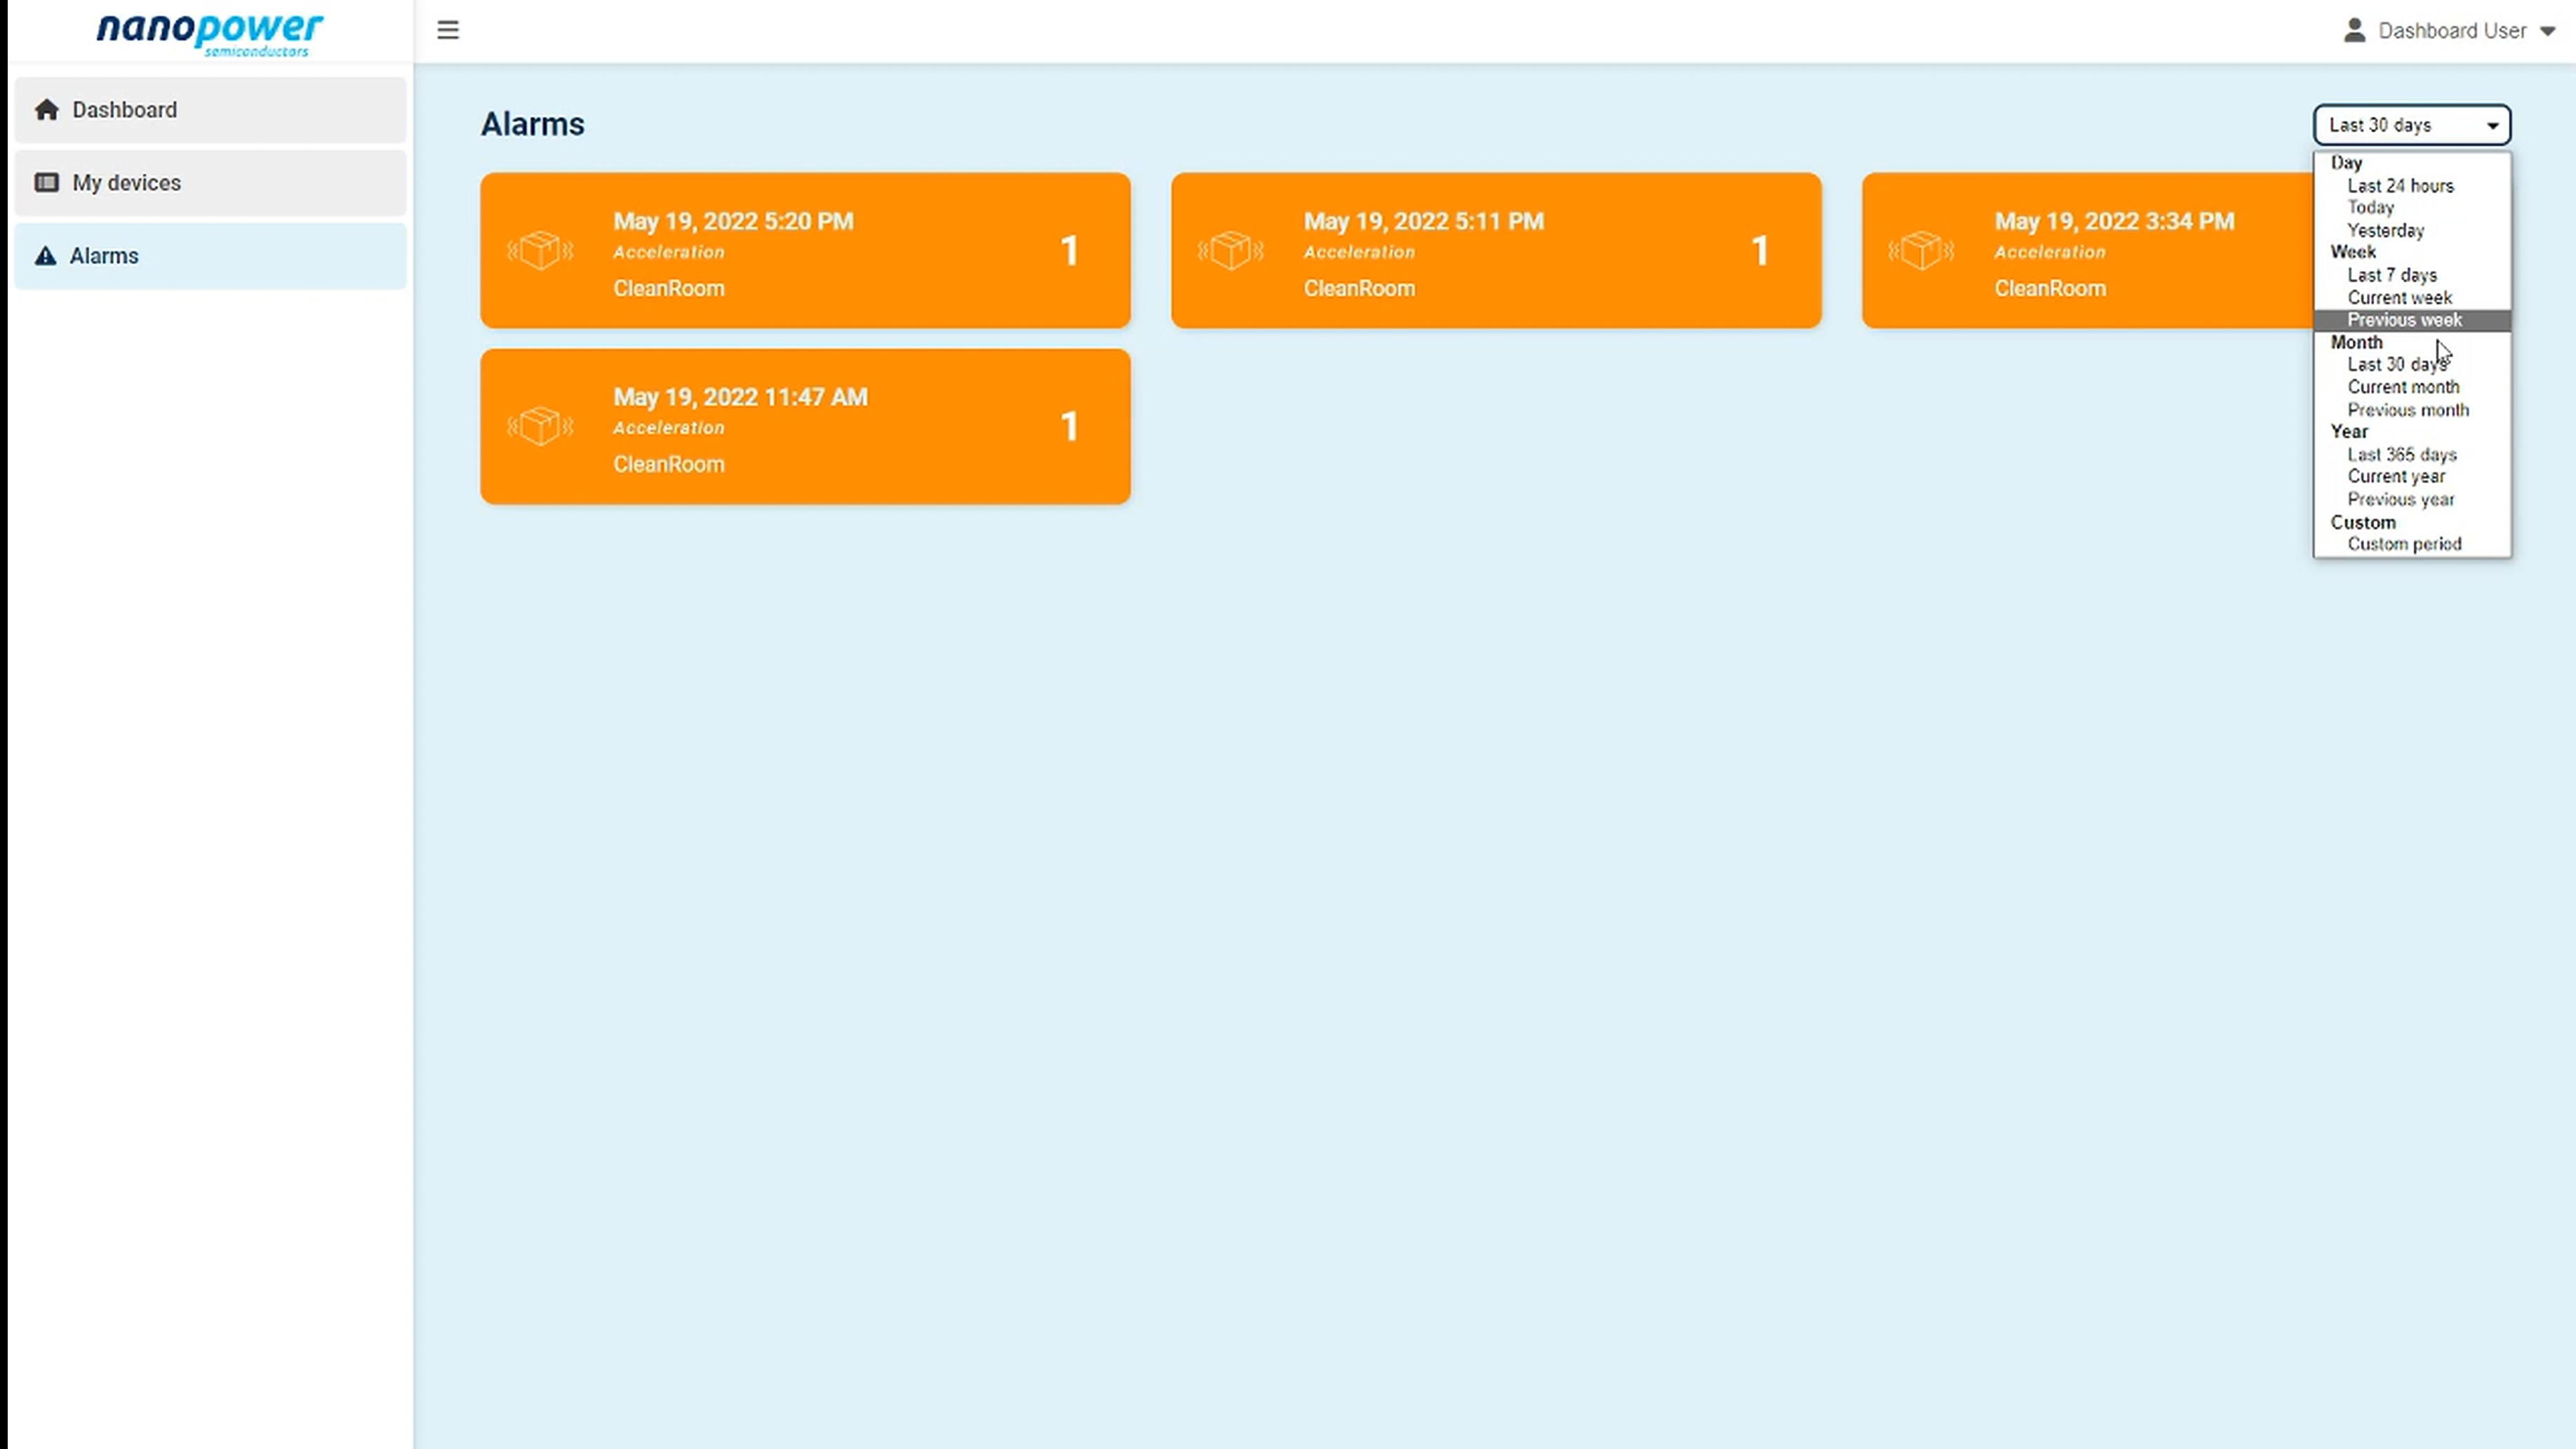
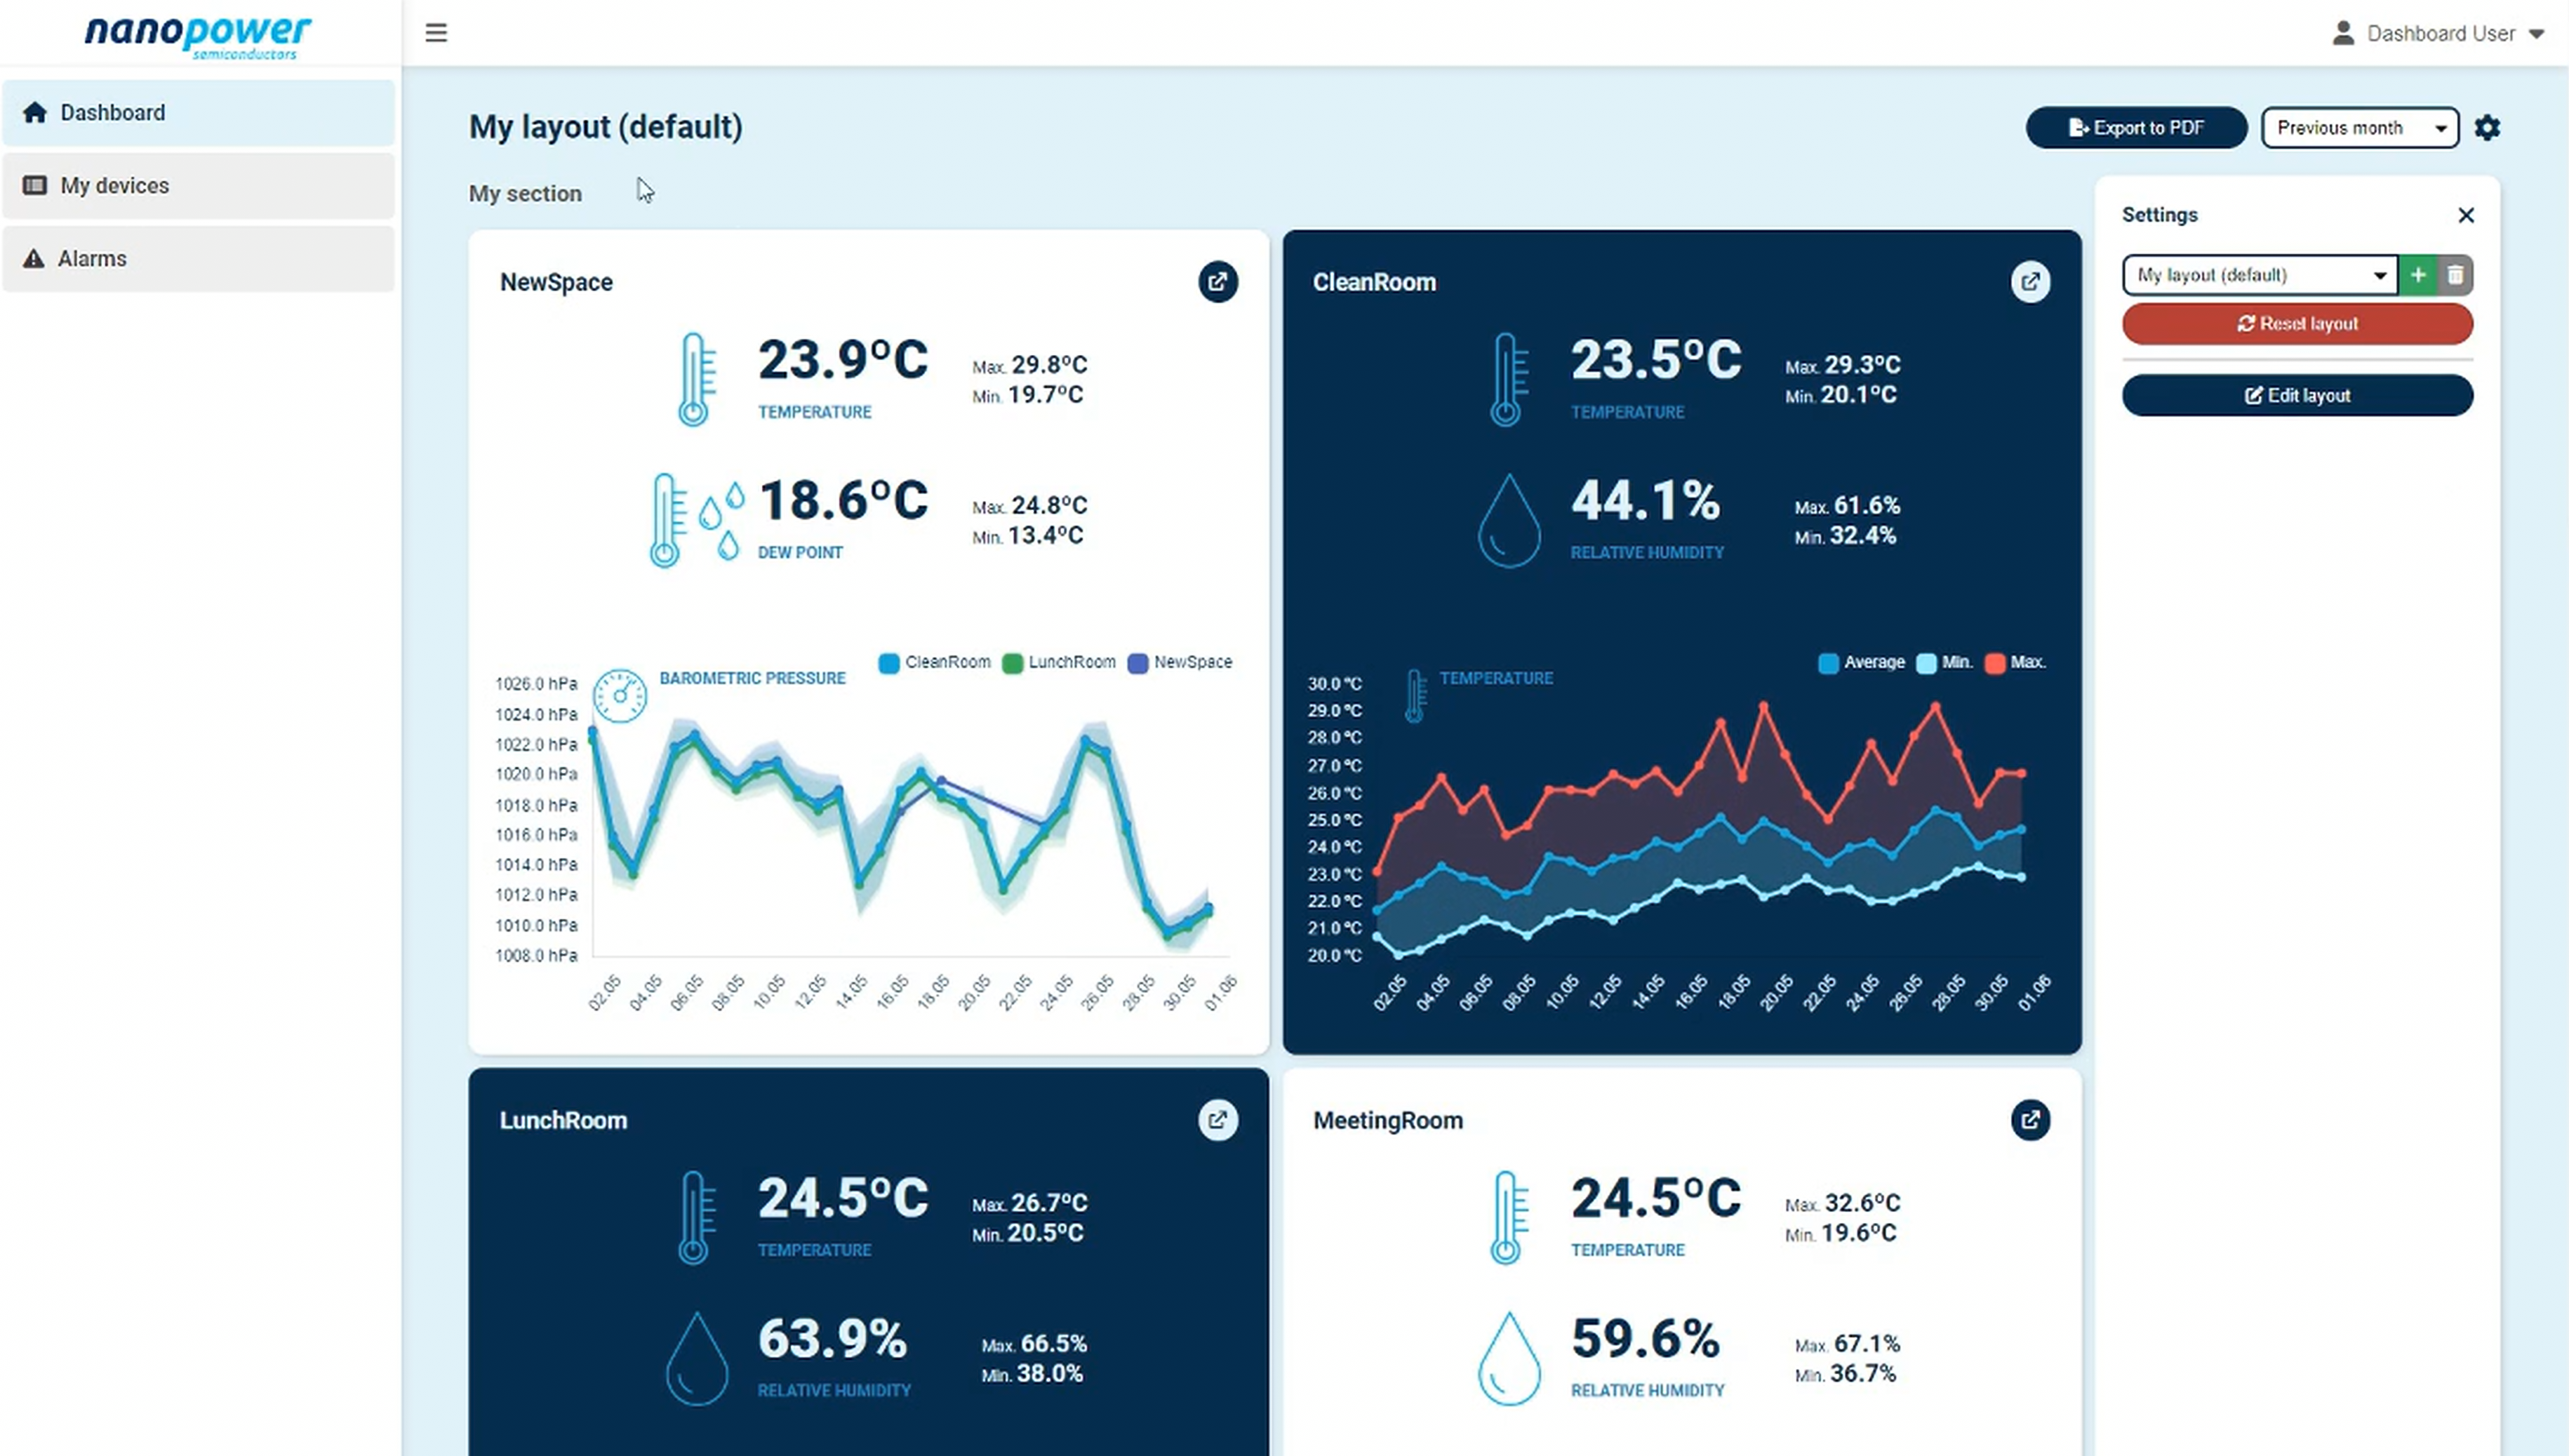
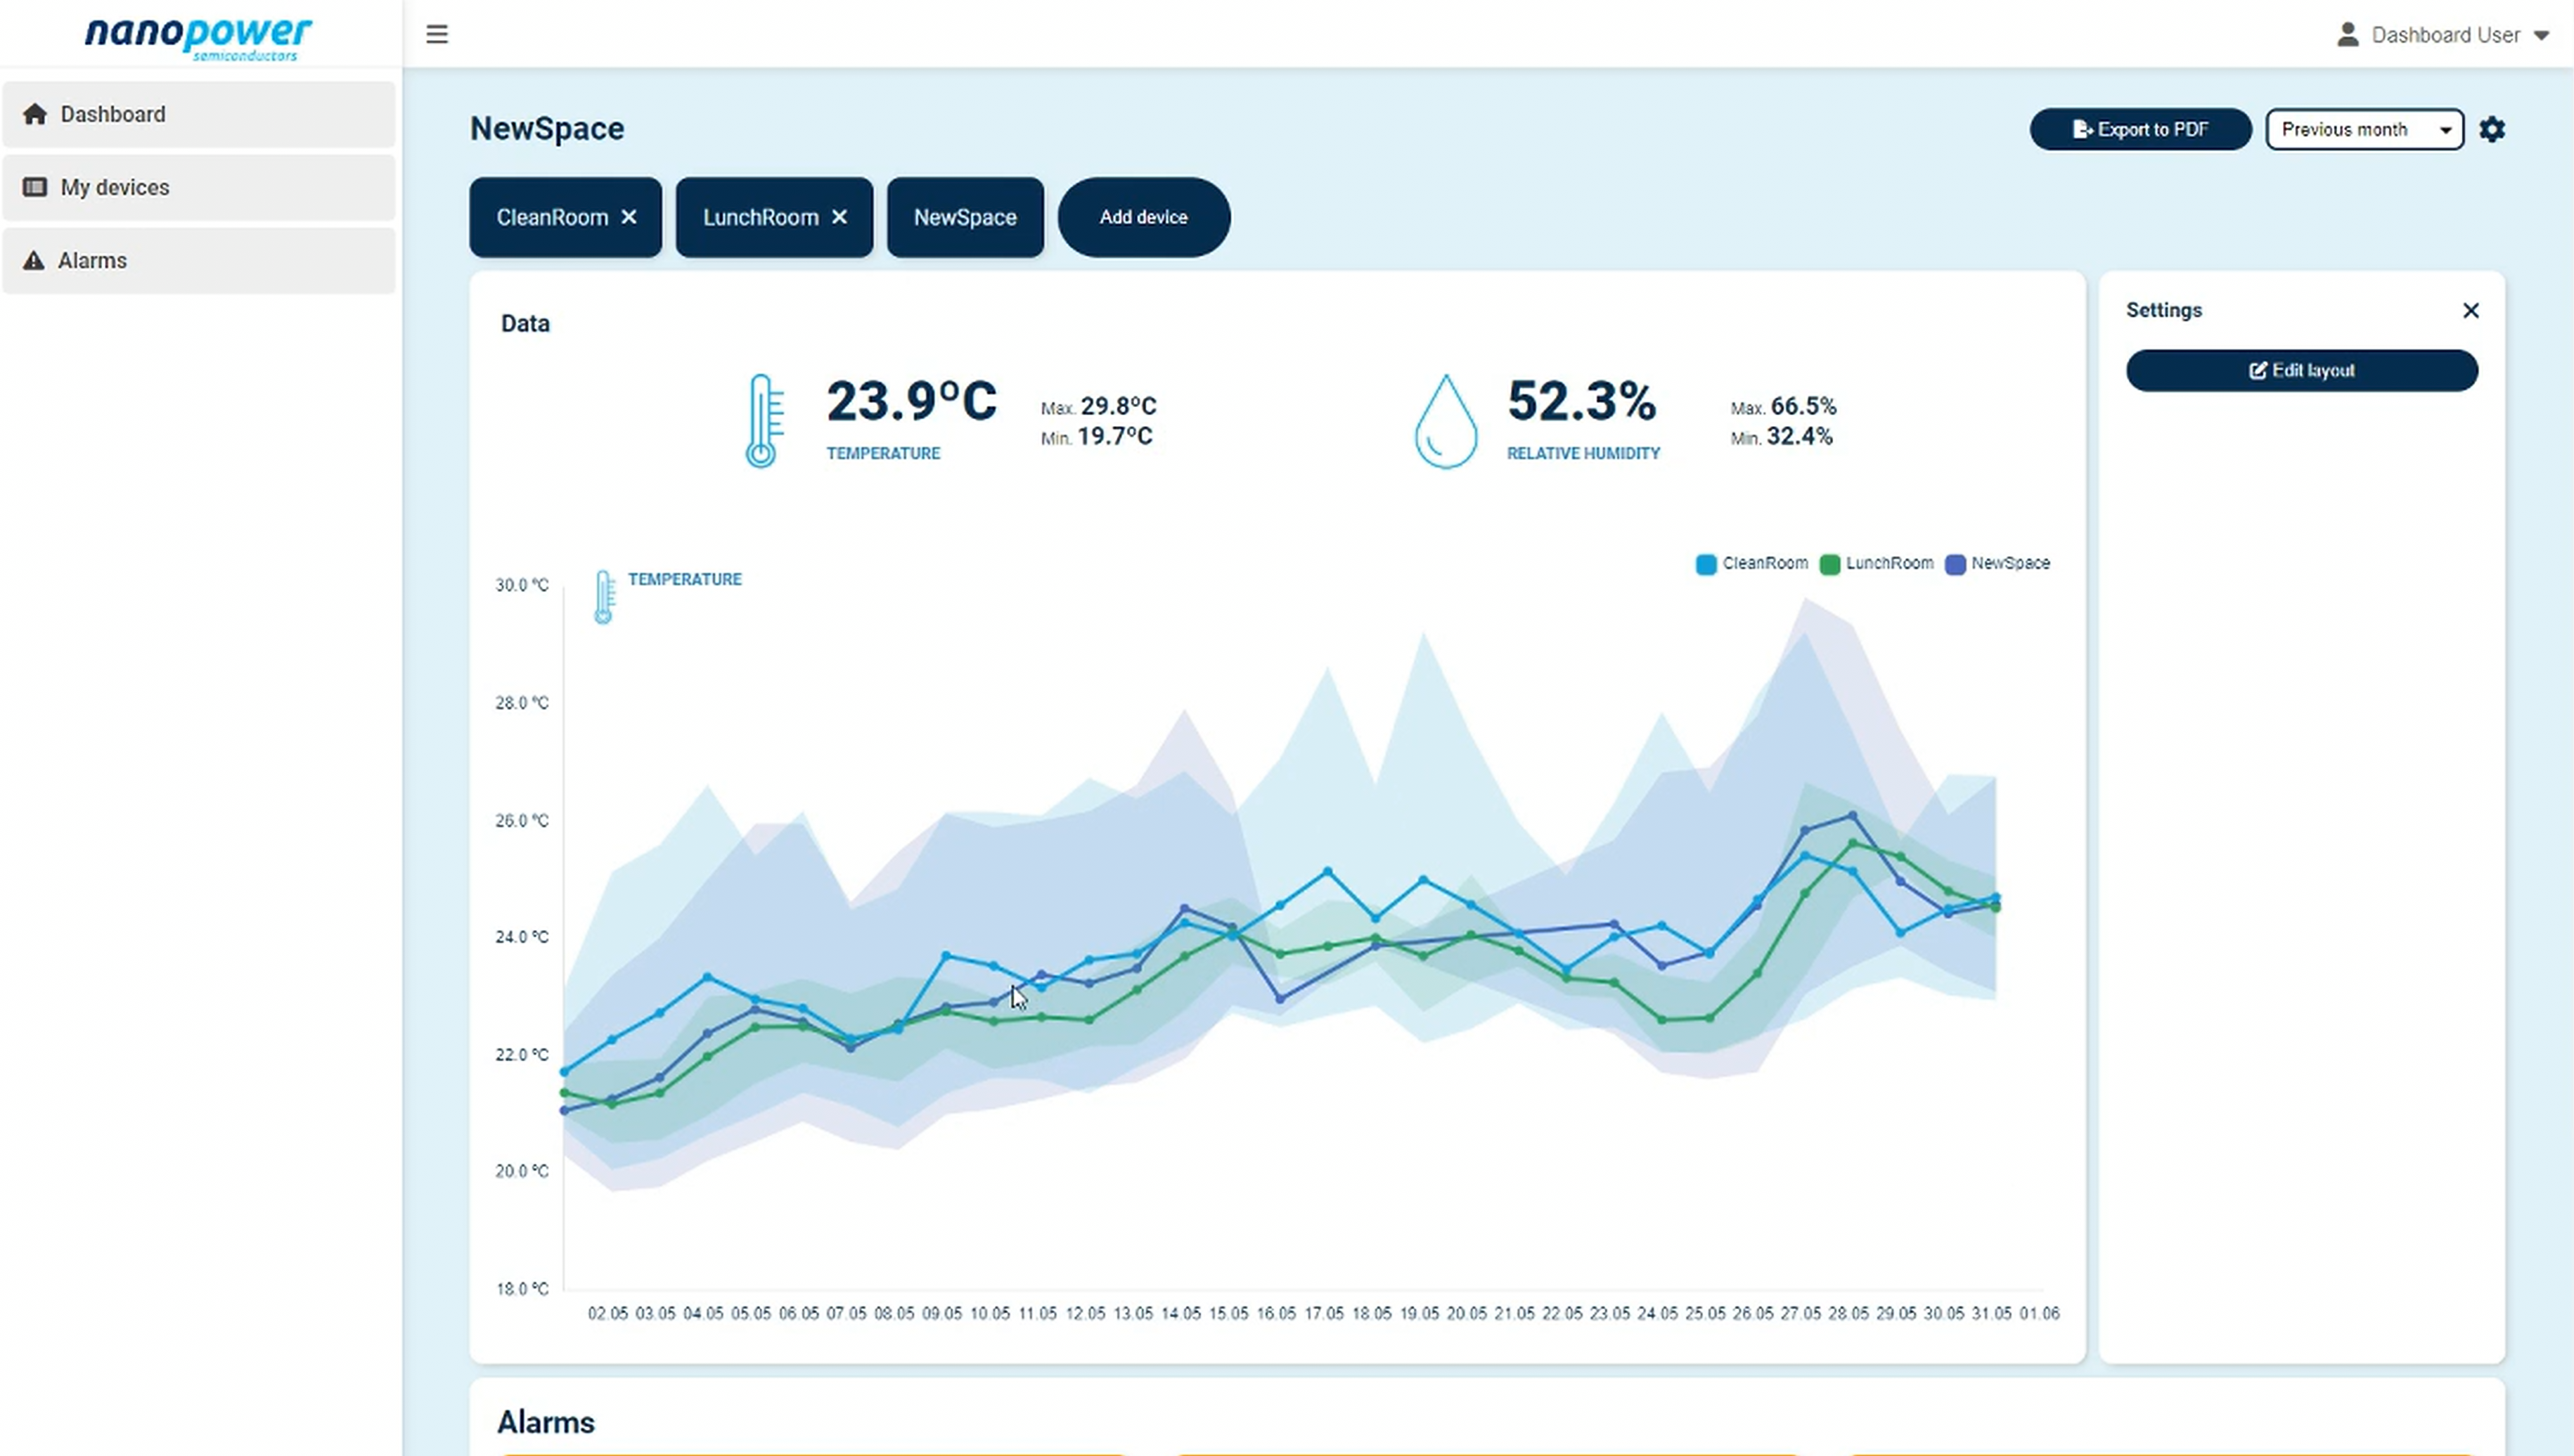
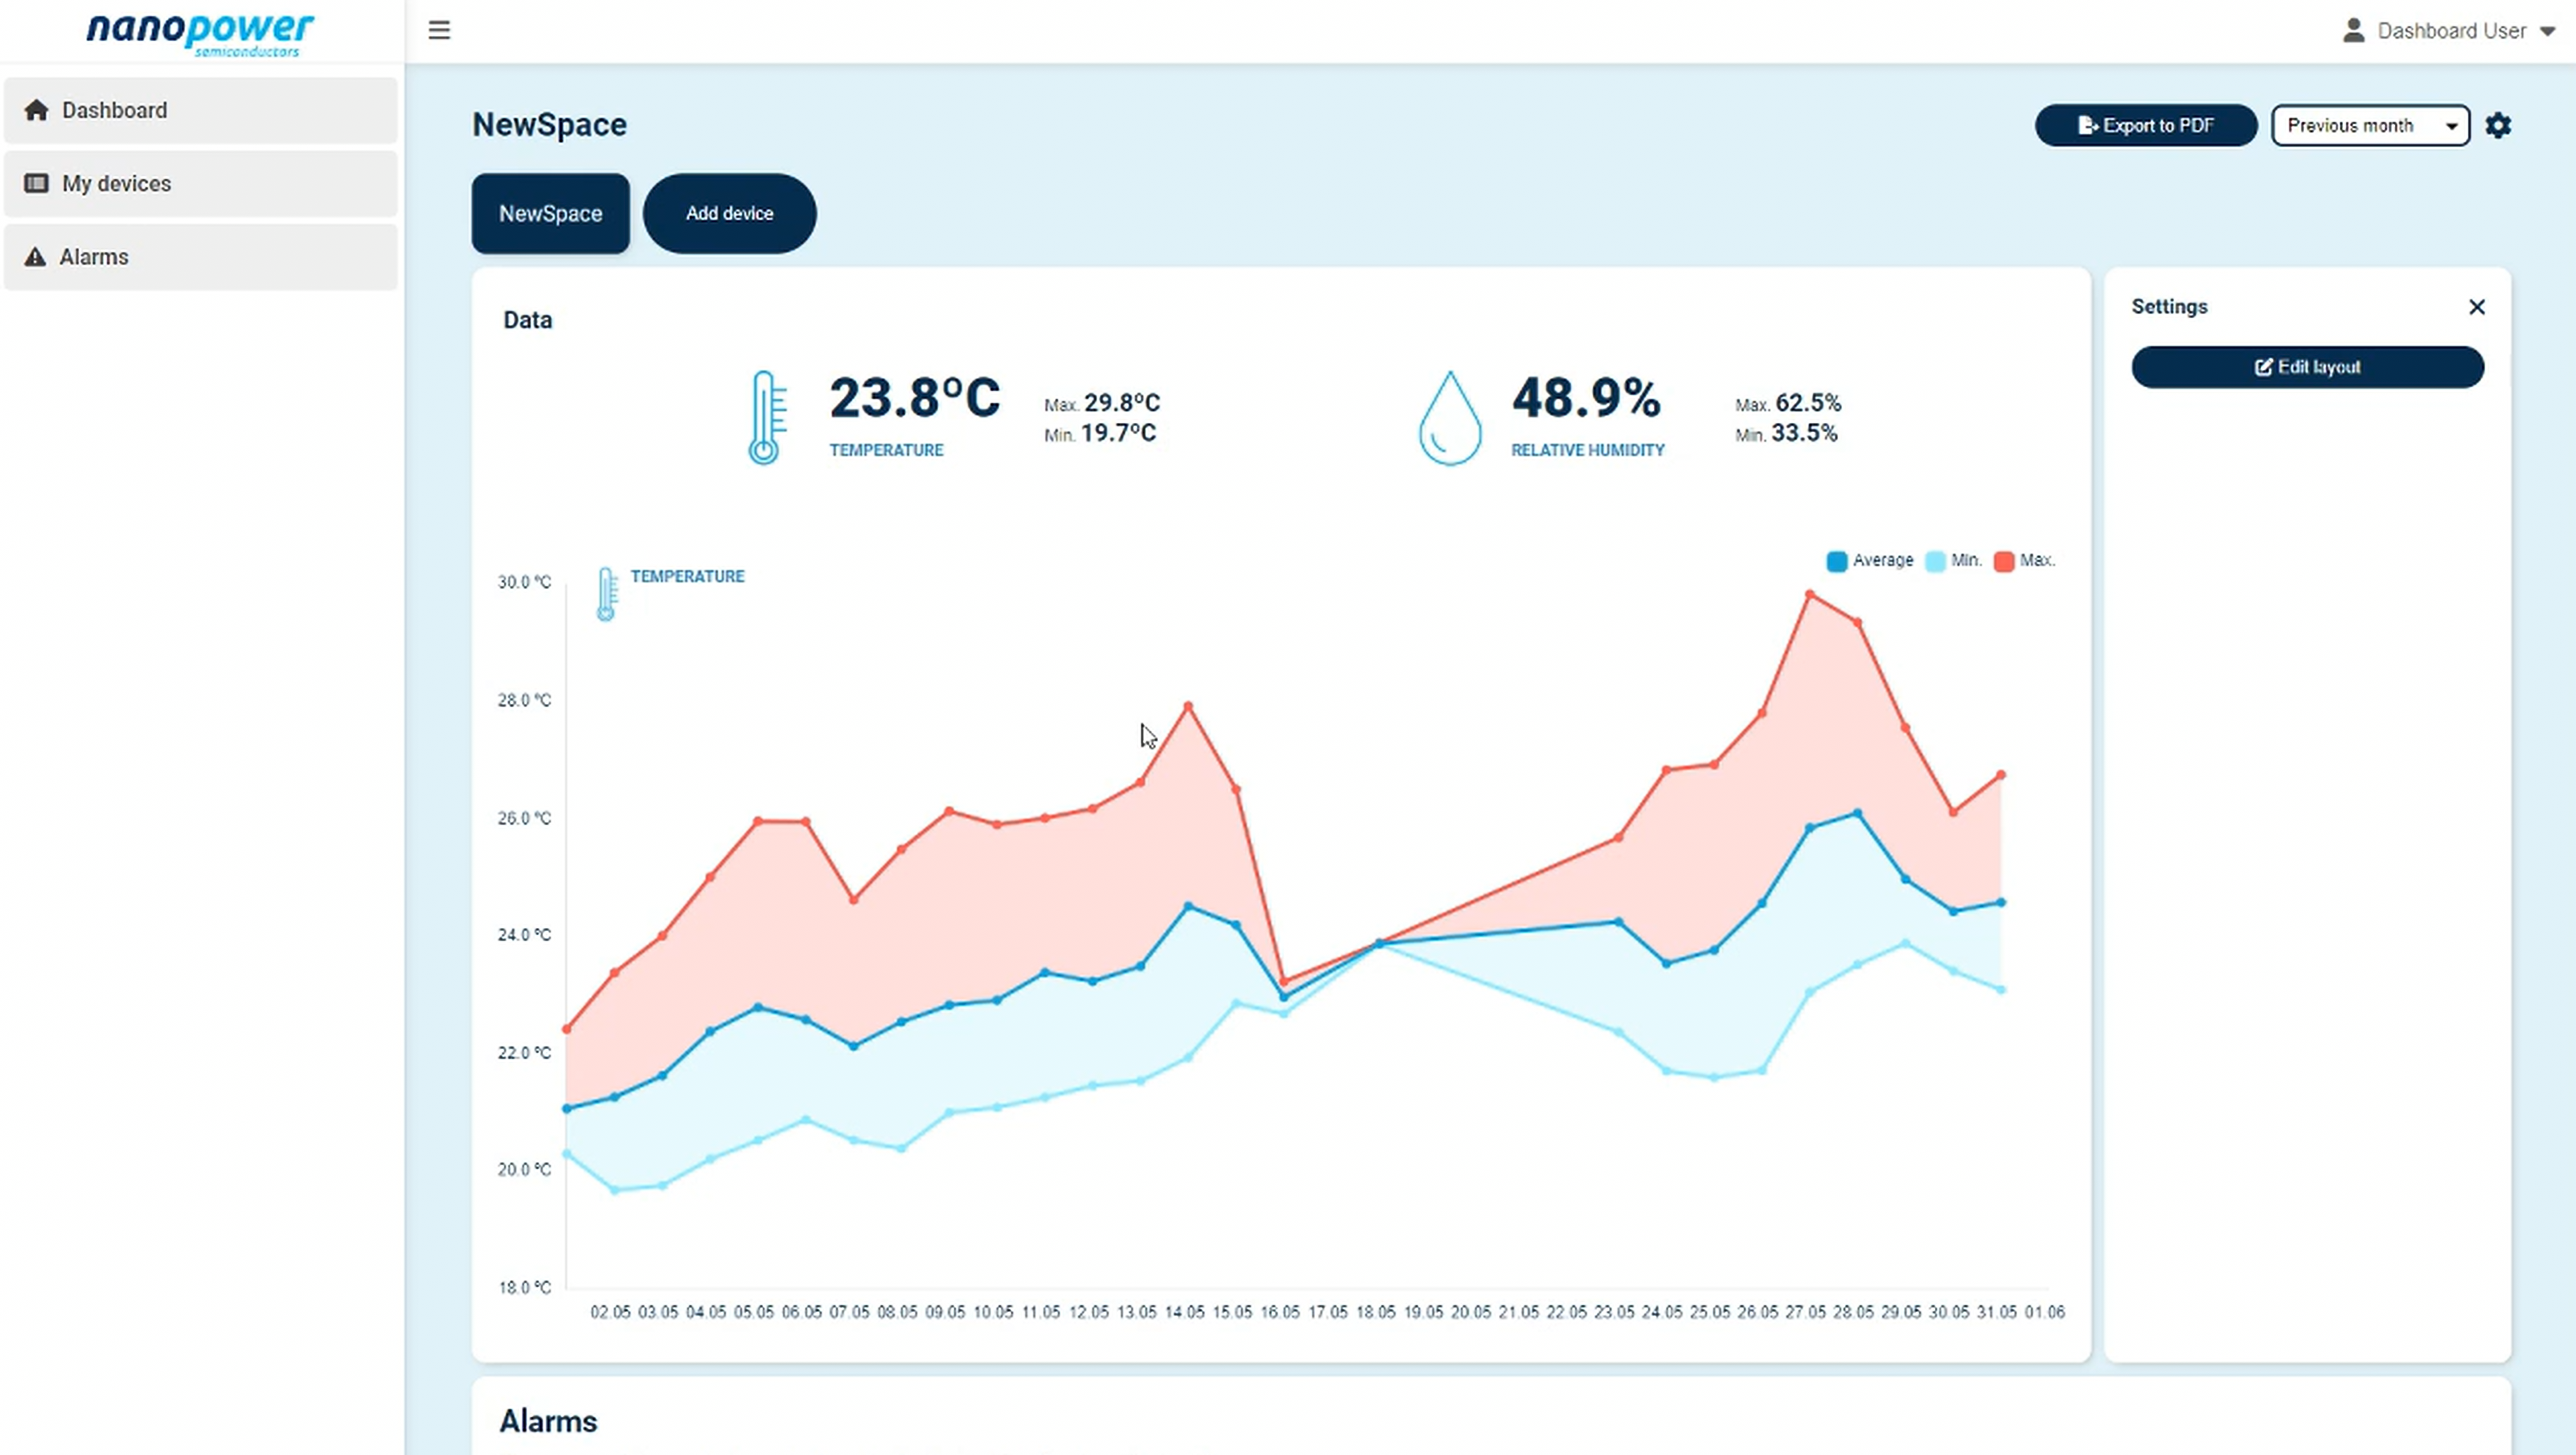
Live measurement: the current measurement of a device (or the average of multiple devices) alongside the min and max for a given time frame
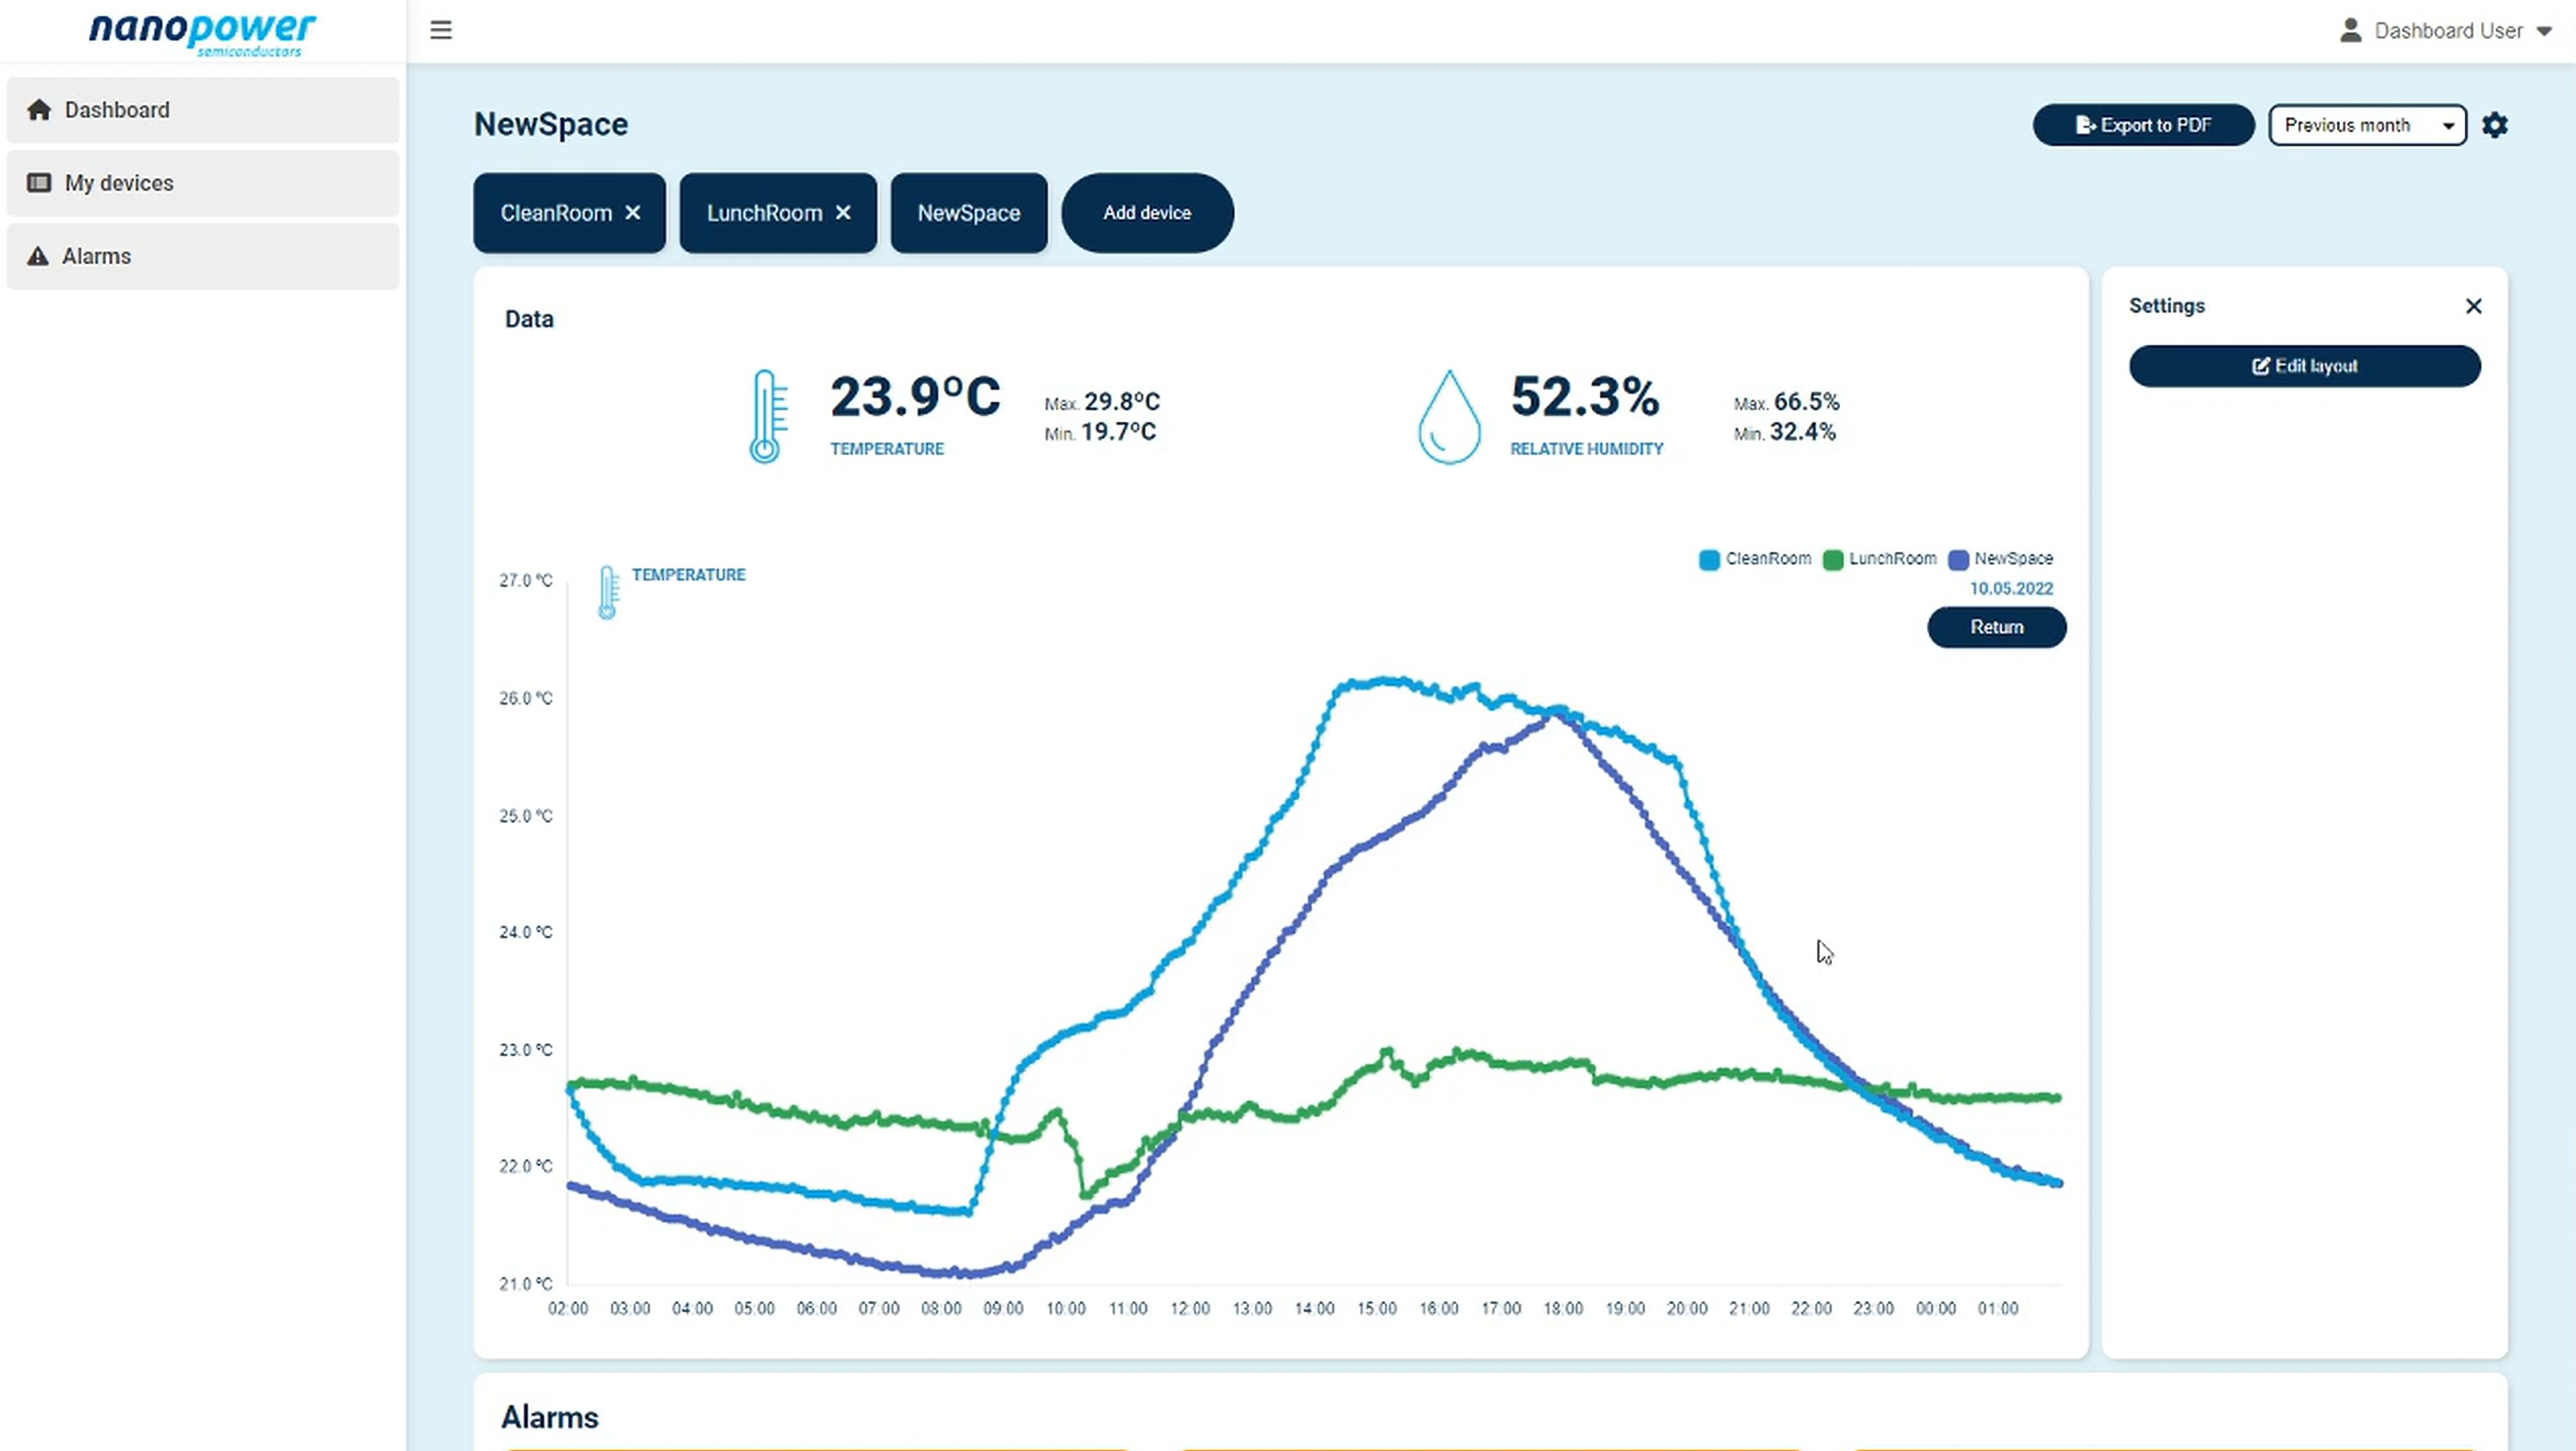
Chart: a chart is a line chart visualisation of historical data for a time frame. The chart is interactive, so the user can see specific measurements from each day, or drill down into measurements taken on a single day.
The user could customise the layouts, modules and visualisations in whatever way they wanted. Using drag and drop the user could place modules and visualisations wherever they want. You would choose a time frame in which all visualisations would get their data, meaning that all charts would visualise the historical data from that time frame and the live measurements would use that data to calculate min and max values.
The application was written in TypeScript using React, the charts were made using chart.js and Sass for styling. We wrote a custom caching solution for the project with support for custom keys, specifying on query parameters and TTL. We supported both English and Norwegian translations. The app also had support for generating a report based on the visualisations, you would pick a layout and a given time frame and could generate a PDF document of those visualisations.